

Abstract
Background: Chronic myeloid leukemia (CML) survival has changed dramatically over the past few decades. In this study we compare mortalities of cases diagnosed in 1973-1985, the transplant and interferon-alpha era of 1986-2000, and the tyrosine kinase inhibitor (TKI) era of 2001-2015, using a novel Poisson regression modeling approach.
Methods: The Surveillance, Epidemiology and End Results (SEER) Program and the Human Mortality Database (HMD) provide large-scale real-world data that allows refined analyses of time-dependent changes in mortality over pre-specified intervals of follow-up after diagnoses. We used Poisson regression modeling to decompose mortality relative risk time courses into subcomponents with different amplitudes and shapes that represent outcomes in patients in different CML phases at diagnosis.
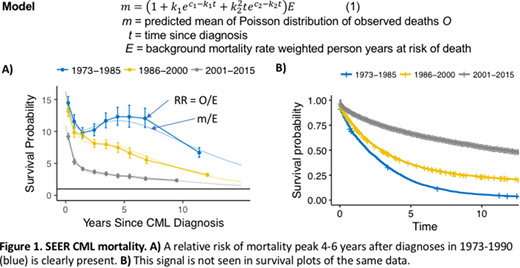
To observed deaths (O) we fitted expected numbers m that equal a modeled rate (in parentheses in Eq. 1) multiplied by a measure of exposure, namely deaths expected (E) if patient time intervals were randomly selected from the US population, using same ages, sexes, and years; E can be thought of as an HMD mortality rate-weighted sum of person-years at risk that controls for unequal risks across ages, sexes and years. Relative risks (RR) of mortality are O/E and m/E (fitted smooth curve in Figure 1A) where O and E are found using the R package SEERaBomb.
Results: CML RR time courses across three different treatment eras are compared to Kaplan-Meier plots of the same data in Figure 1. For the 1973-1985 era, whereas two interesting high frequency signals are clearly revealed by RR time courses in Figure 1A, they are concealed in survival probability plots in Figure 1B. Comparing 1973-1985 to 1986-2000 in Figure 1A, by inspection, there were practically no improvements in mortality for those diagnosed in late stages but sizeable improvements for those diagnosed in chronic phase, seen as a reduction in the hump that otherwise peaked strongly at ~5 years. RR plots also reveal that the most recent era (2001-2015) brought with it sizeable reductions in both the early and the late components of the RR time course. These inferences by inspection were confirmed by fitting Eq. (1) to SEER data to produce the thin smooth curves in Figure 1A. In this fit the decay rate of the initial exponential was kept constant across eras as all other parameters were freely fitted. The amplitude of the early exponential risk subcomponent did not differ between 1973-1985 and 1986-2000 (P=0.86) but did between 1973-1985 and 2001-2015 (P<10-16). We also found that the rate constant of the second RR subcomponent increased by 0.07 (0.05, 0.09) between 1973-1985 and 1985-2000 (P = <10-10), i.e. that the hump shifted to the left for CML cases diagnosed in the interferon-alpha/transplant era. No shift [0.03 (0, 0.07), P = 0.06] was found between 1973-1985 and 2001-2015.
Discussion: Relative to survival plots, advantages of RR time course representations of mortality include: 1) retention of high frequency signals such as initial spikes and subsequent humps; 2) a standard reference line (RR=1) that indicates how close we are to cures; and 3) opportunities for ad hoc Poisson regression modeling that can focus questions and thus discern specific differences between groups, e.g. differences in RR time course component amplitudes vs. shapes. A drop in the amplitude of the early RR component only in 2001-2015 is consistent with TKI being effective in CML cases diagnosed in accelerated phase and interferon/transplants not being effective in such patients; this drop not falling closer to zero reflects TKI not being effective in patients diagnosed later, in blast crises. The second RR subcomponent, which rises to a peak at ~5 years in 1973-1985 and falls thereafter, likely reflects waiting times for an additional hit needed for chronic phase CML to progress to blast crisis/death. The extent to which interferon-alpha and/or transplants ablated this peak is remarkable. Hump amplitude lowering might be interpreted as immune system mediated progression suppression. Hump shape left-shifting might be interpreted as DNA damaging agent acceleration to blast crisis in patients in which immune system progression suppression failed.
Conclusion: Relative to survival analyses, Poisson regression modeling of mortality RR time courses provides an additional dimension of hypothesis formulation and testing that could be useful in CML outcome analyses.
Maciejewski:Apellis Pharmaceuticals: Consultancy; Apellis Pharmaceuticals: Consultancy; Ra Pharmaceuticals, Inc: Consultancy; Alexion Pharmaceuticals, Inc.: Consultancy, Membership on an entity's Board of Directors or advisory committees, Speakers Bureau; Ra Pharmaceuticals, Inc: Consultancy; Alexion Pharmaceuticals, Inc.: Consultancy, Membership on an entity's Board of Directors or advisory committees, Speakers Bureau.

This feature is available to Subscribers Only
Sign In or Create an Account Close Modal